I simulated 29.28 billion random chess games consisting of random moves chosen uniformly among all legal moves. My main discovery is that White is slightly more likely to checkmate than Black (7.7340% vs 7.7293%), and the number of simulated games is large enough to make the difference statistically significant (21-sigma confidence).
In the table below I've broken down game termination by type, with the corresponding article number from the FIDE Laws of Chess. I do not list draws by the 3-fold repetition rule (articles 5.2d, 9.2) or by the 50-move rule (articles 5.2e, 9.3) because these draws are not automatic: they must be claimed by one of the players. Since claiming those draws is optional, I decided that my synthetic players would prefer to continue playing more random moves. On the other hand I have to take into account the 5-fold repetition rule and the 75-move rule which are the automatic versions of the previous rules. I didn't bother to program the 5-fold repetition rule because it applies to consecutive repetition, and a little thought shows that triggering it requires a completely determined sequence of about 20 plies, which is unlikely to occur at random. The 75-move rule is recent (2014) and somewhat arbitrary, so I also give statistics without it.
| Reason | Article | Fraction (%) | Without the 75-move rule (%) |
|---|---|---|---|
| checkmate | 5.1a | 15.4633 ± 0.0002 | 15.5546 ± 0.0002 |
| stalemate | 5.2a | 6.5364 ± 0.0001 | 6.7708 ± 0.0001 |
| 5-fold repetition | 9.6a | ~0% | ~0% |
| 75-move rule | 9.6b | 12.0118 ± 0.0002 | 0% |
| insufficient material | 1.3, 5.2b, 9.7 | 65.9886 ± 0.0003 | 77.6742 ± 0.0002 |
| blocked position | ~0% | 0.000504 ± 0.000001 |
"Insufficient material" and "blocked position" are two causes of draw by impossibility of checkmate. Blocked positions should end the game immediately according to the Laws of Chess, but this is too difficult to program, so instead blocked positions were detected when the game reached 10,000 plies and didn't end for any of the other reasons. This means that I can only detect blocked positions without the 75-move rule, and I cannot tell which player caused the blocked position. The blocked positions found by the simulation had between 8 and 17 pieces. Below is an example of a blocked position that was reached at random. I picked an unusual position with one knight and two bishops.
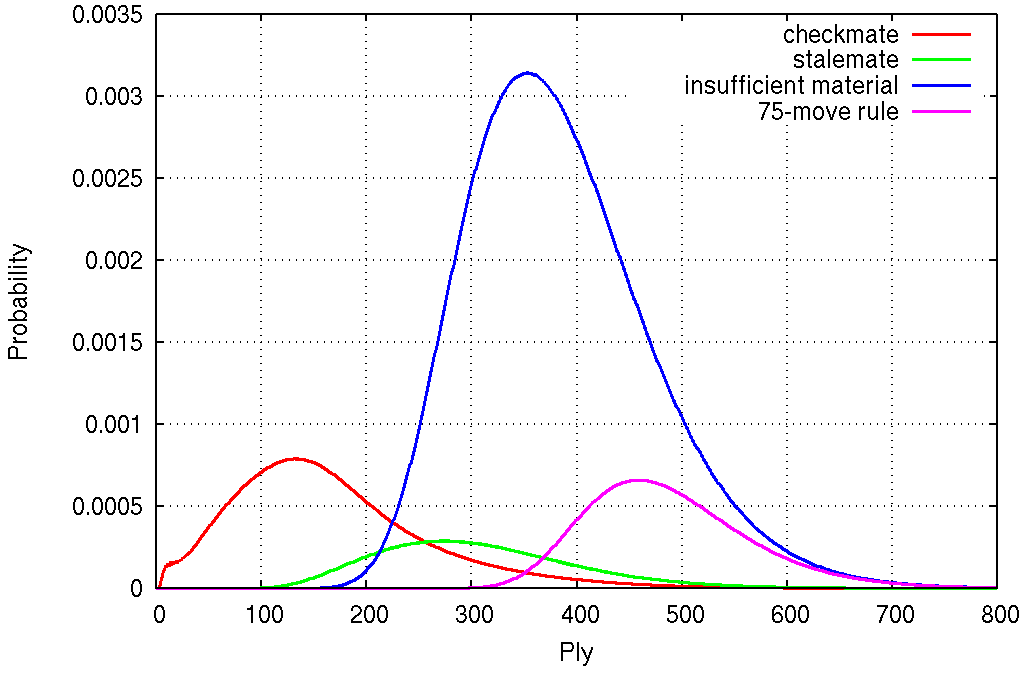
Below is a plot of the probability of each type of endgame for each ply. The integral (area under the curve) gives the overall probability from the table above.

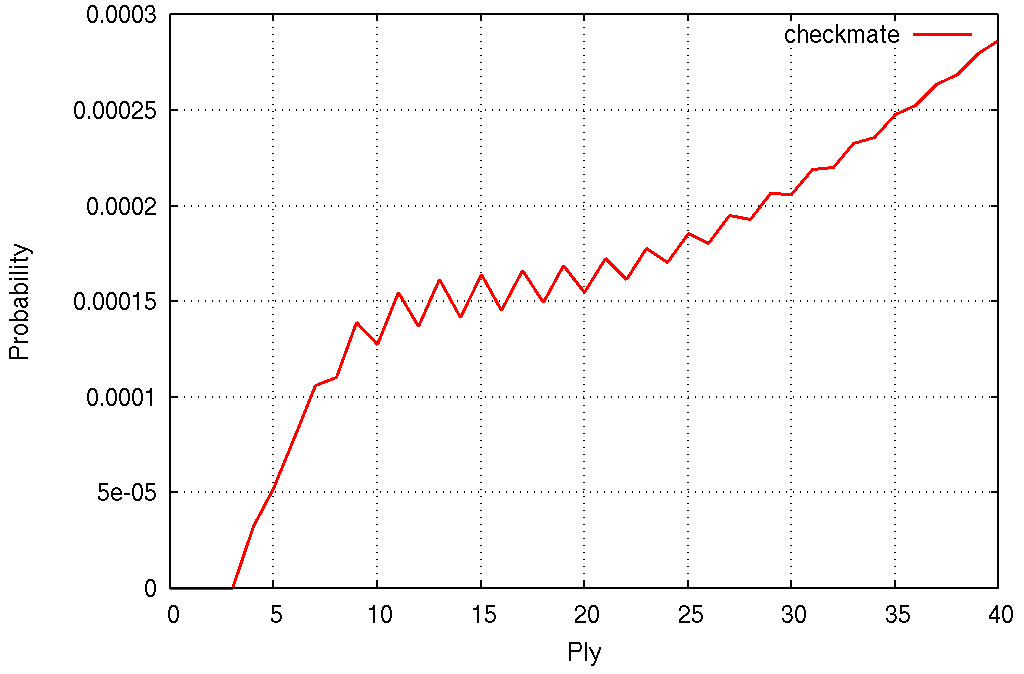
The checkmate curve deserves a zoom-in. The shortest checkmate is by Black at ply 4, so Black starts ahead, but later we see spikes at odd plies, which means that White quickly gains an advantage.

For small plies, I was able to directly compute the probability of game termination (as opposed to estimating it using random games).
| exact probability of checkmate (rounded to 20 digits) | |
|---|---|
| ply 4 | 0.00003252384994744927 |
| ply 5 | 0.00005203302269729754 |
| ply 6 | 0.00007899349825993504 |
| ply 7 | 0.00010589732376673660 |
| ply 8 | 0.00011015692490256506 |
| ply 9 | 0.00013844617672015683 |
| ply 10 | 0.00012747076885663533 |
| exact probability of checkmate (as a reduced fraction) | |
|---|---|
| ply 4 | 32183 / 989520000 |
| ply 5 | 275062568550753939939673 / 5286307700225917781095680000 |
| ply 6 | 1259539137236405179073987700010718679274361 / 15944845651622885777913335913827610574080000000 |
| ply 7 | 6795731819624501622630615704494673542714026017897565393648480103 / 64172838159665641413859840104706794890745650613373350756556800000000 |
| ply 8 | 3818593265767102093368612685666117391523629781132931725412676010453615047621183598650346577 / 34665031446227166606082236339271826532241481680593297105987261491577803364388675584000000000000 |
| ply 9 | 3149420780275808719262306374304328215640590114337026021569331565948455752627553337270739207779937146392240937497806337 / 22748340581782742679157419640484185516104744278278613034770353637876350749173248300031515491241529792081166336000000000000 |
| ply 10 | 85450562846936719424225491089505539944466158797276373130175540777100978755580105049204295386124545191772347455404439217507855630585020328655443 / 670354180910619798429732866521176768382607715033428649372376951710178762965984271245861665225558829532239206105291521824473984532480000000000000000 |
The denominators always factorize into small primes. For example, the denominator for ply 4 is 27×3×54×7×19×31 and the denominator for ply 5 is 211×34×54×72×113×132×172×192×29×312×37×43. This can be explained in two steps:
Here we look at the same statistics, but separately for White and for Black (the player who played the move that ended the game).
| Reason | Fraction white (%) | Fraction black (%) | Difference (%) |
|---|---|---|---|
| checkmate | 7.7340 ± 0.0002 | 7.7293 ± 0.0002 | 0.0047 ± 0.0002 |
| stalemate | 3.2497 ± 0.0001 | 3.2866 ± 0.0001 | −0.0369 ± 0.0001 |
| 75-move rule | 6.0109 ± 0.0001 | 6.0009 ± 0.0001 | 0.0100 ± 0.0002 |
| insufficient material | 33.0453 ± 0.0003 | 32.9432 ± 0.0003 | 0.1021 ± 0.0004 |
| Reason | Fraction white (%) | Fraction black (%) | Difference (%) |
|---|---|---|---|
| checkmate | 7.7795 ± 0.0002 | 7.7750 ± 0.0002 | 0.0045 ± 0.0002 |
| stalemate | 3.3667 ± 0.0001 | 3.4041 ± 0.0001 | −0.0374 ± 0.0001 |
| insufficient material | 38.8966 ± 0.0003 | 38.7776 ± 0.0003 | 0.1189 ± 0.0004 |
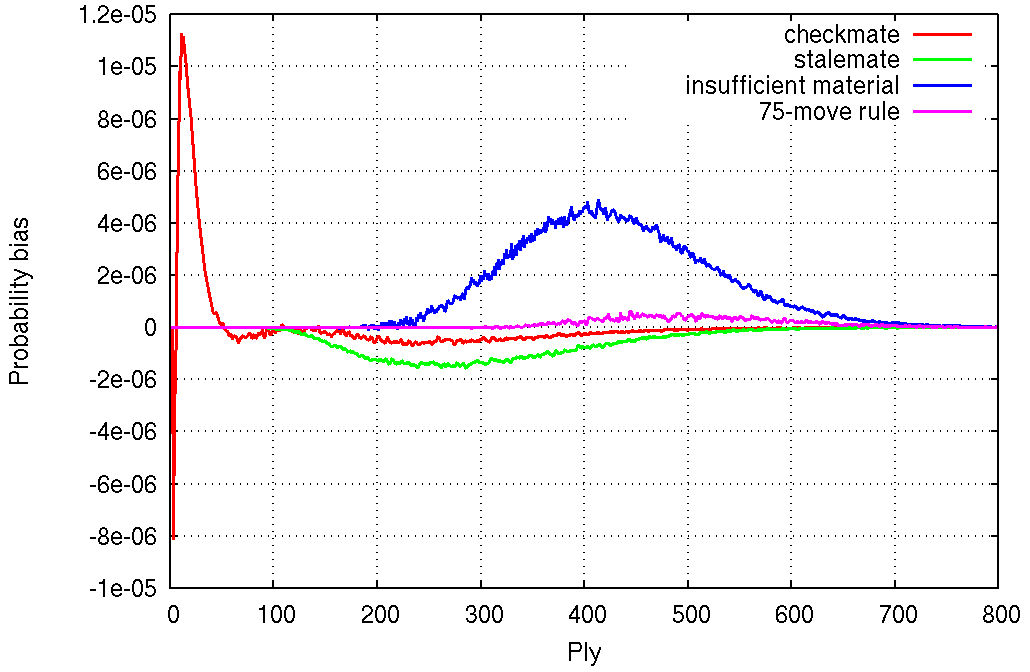
The differences are small but statistically significant, so there must be an explanation. First, let's look at the breakdown by ply.
Player bias per ply is more tricky to define. One way is to look at the difference between the value at ply n and the average of the neighboring values at plies n−1 and n+1, and to negate it for Black to always get a number that is positive when the difference favors White. More precisely, for an arbitrary function f(n), I define the player bias g(n) at ply n to be
g(n) = [−0.25 f(n−1) + 0.5 f(n) − 0.25 f(n+1)] (-1)n+1.
The constants were chosen so that
… + g(0) + g(1) + g(2) + g(3) + … = … − f(0) + f(1) − f(2) + f(3) − …
and the integral matches the overall difference between White and Black from the table above.

One theory is that White's development is always one step ahead of Black, which gives White a checkmating advantage in the beginning, but each check which fails to checkmate is likely to be punished by the capture of the checking piece (the opponent must play a random move among those that defend from the check), which eventually gives Black a material advantage and a checkmating advantage. This reversal arrives too late to completely erase White's initial checkmate advantage, but it arrives just in time to provide Black with a stalemate advantage.
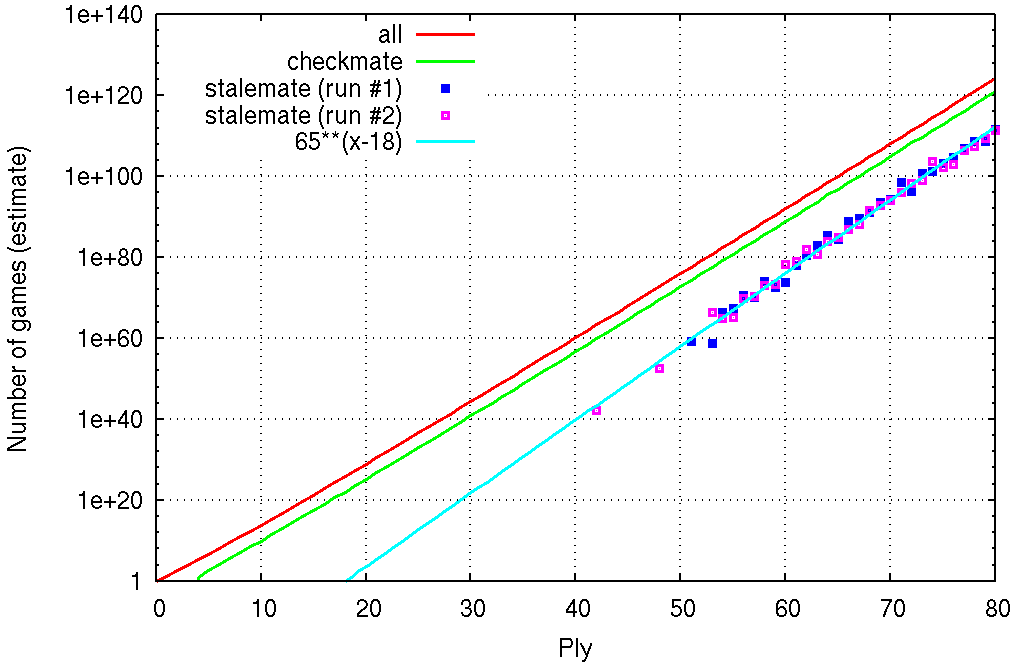
The set of games reached through n random plies is not a uniformly random sample of all possible games after n plies because games that have large fan-outs throughout are less likely to be picked at random. By keeping track of the product of the fan-outs during the simulation, it is possible to compensate for this and to get an unbiased estimate of the number of games after n plies. Below are such estimates obtained from 11.65 billion random games. The stalemate curve is noisy and to give an idea of the uncertainties I plotted two separate runs of about 6 billion games each.

The shortest stalemate obtained at random was 42 plies long, and that particular game had a product of fan-outs of 9.017791×1051, which roughly indicates that there are 9.017791×1051 / (11.65×10⁹) games ending in stalemate at ply 42. I extrapolated the stalemate data towards the left to predict the length of the shortest possible stalemate, and it gives a good match against the shortest known stalemate which is 19 plies long.