Enter player ratings or pick two players from a list. Alternatively, enter an Elo difference or an expected score (and a draw probability for Chess). Dependent variables will automatically adjust.
Choose a rating source:
(players rated 2400 or better, source)
(source)
(source)
(players rated 4d or better, source)1,3
(players rated 4d or better, source)2,3
4
(source)5
(source)5
Rating 1
Rating 2
First to move (only has an effect for Chess):
Elo difference:
Elo formula:
Player 1 expected score: (for one game, or one set in Tennis)6
Draw probability: (see note)7
Enter match details to obtain the probabilities of winning a match.
Competition format:
by a margin of two. (Draw probability must be zero.)
One-click settings:
Current score:
| Outcome | Probability |
|---|---|
| player 1 win | |
| player 2 win | |
| draw |
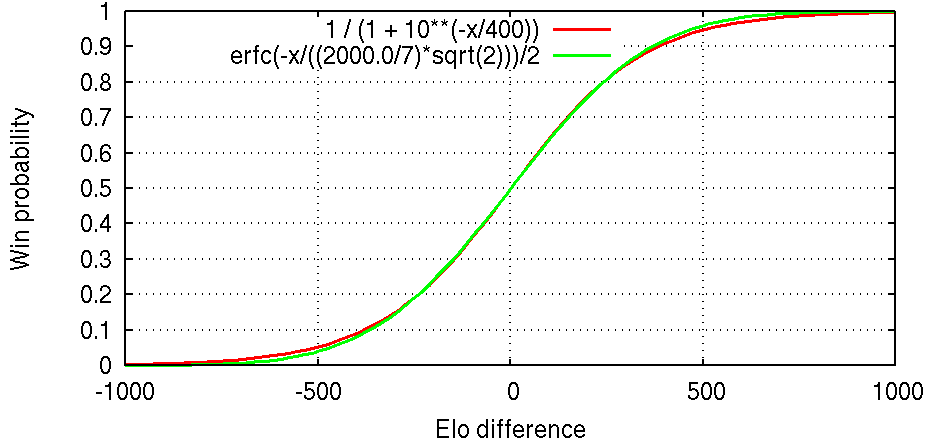
The starting point of the Elo rating system is a curve mapping rating differences to expected scores (which is the same as win probabilities if there are no draws). Unfortunately there is disagreement over which curve should be used. As an example, in a game with no draws if player A has an 80% chance of beating B, and if B has an 80% chance of beating C, then what is the probability of A beating C? If you think that the answer is approximately 94.1%, then you're in the "logistic distribution" camp. If you think that the answer is approximately 95.4%, then you're in the "normal distribution" camp.
Both are justified mathematically: In our example, the chances of winning are in a ratio of 4:1 between A and B and in a ratio of 4:1 between B and C, so it's reasonable to expect a ratio of 16:1 between A and C, giving a probability of A beating C of 16/17 ≈ 94.1%, the logistic distribution value. Another approach is to assume that if A has a (50+ε)% chance of beating B, and if B has a (50+ε)% chance of beating C, then A has a (50+2ε)% chance of beating C. Now, whatever is the game A, B and C are playing, best-of-n is a meta-game that the players can also play. If we find n such that (50+ε)% becomes 80% in a best-of-n, then (50+2ε)% becomes 95.4% in a best-of-n, the normal distribution value.
The normal distribution was apparently Arpad Elo's original suggestion, but it is quite harsh on the underdog and many people claim that the logistic distribution works better in practice, so what should we use? I don't know. This page automatically selects the distribution recommended by the rating source, but it lets you override it.
In chess, material odds is a form of handicap where some pieces of the stronger player are removed from the starting position. A chess player is "one pawn stronger" than another player if he can give a pawn and have an expected score of 0.5. A ranking system based on material odds is perfectly possible: the strength of a player could be described by the material odds needed against a chess master, and actually that was the way chess strength was described in the mid-19th century according to the history section of Handicap (chess).
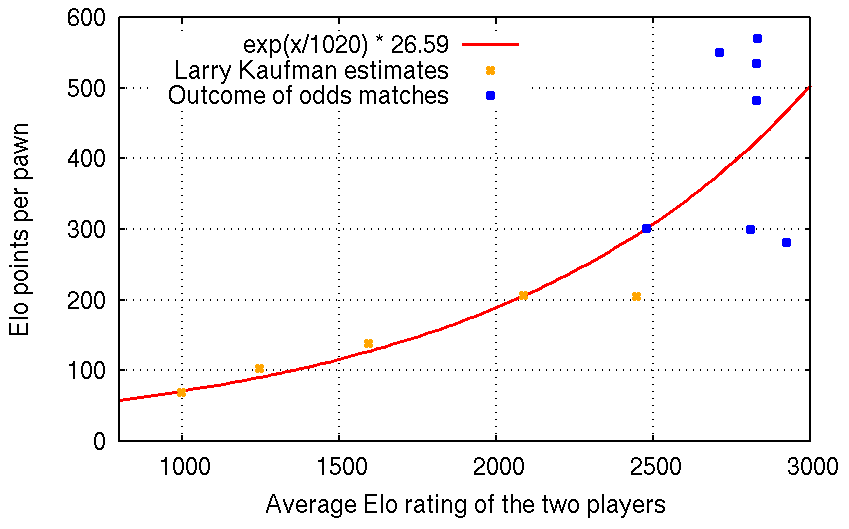
How do we translate between Elo and material odds? The first thing to realize is that the number of Elo points equivalent to one pawn varies with the strength of the players. Some estimates by GM Larry Kaufman are given in the "Rating equivalent" section of the article linked above. More data points are given by matches played with material odds or draw odds between two human players or between a human and a computer, some of which are discussed at the end of the "History" section. I fitted a curve as best as I could and below is a graph of the result. The calculator applies this curve to display material odds when given two Elo ratings.
Let's give names to the two functions corresponding to the two plots above. The first function is from FIDE, and the second function is from myself.
eloNormal(eloDiff) = erfc(-eloDiff / ((2000.0/7) * sqrt(2))) / 2
eloPerPawnAtElo(elo) = exp(elo/1020) * 26.59
The input is rating1 and rating2, where rating1 ≤ rating2.
diff = rating1 - rating2
ave = (rating1 + rating2) / 2
expected_score = eloNormal(diff)
We compute what an advantage of 0.6 pawns corresponds to in Elo:
eloPerPawn = eloPerPawnAtElo(ave)
eloShift = eloPerPawn * 0.6
We consider the chess variant where a draw counts as a loss for player1 by penalizing rating1 by eloShift:
player1_win_probability = eloNormal(diff - eloShift)
Remember that the expected score is the probability of winning plus half of the probability of drawing, so:
draw_probability = (expected_score - player1_win_probability)*2
rating1 = 2000
rating2 = 2400

diff = -400
ave = 2200
expected_score = eloNormal(-400) = 0.080757

eloPerPawn = eloPerPawnAtElo(2200) = 229.843
eloShift = 229.843 * 0.6 = 137.906

player1_win_probability = eloNormal(-400 - 137.906) = 0.029872
draw_probability = (0.080757 - 0.029872) * 2 = 0.101770
Handicap stones in Go are the rough equivalent of material odds in Chess since both are modifications of the start position so that both players have equal chances of winning. A ranking system based on handicap stones is the dan/kyu system which is the preferred way to communicate Go strength for amateurs. Pandanet provides a table giving the correct (fair) handicap for each difference in rank. To make the scale absolute, we traditionally define 7 dan to be the (amateur) rank of a newly accepted professional player. (This is enforced by the EGF, but other rankings don't enforce it and ranks can differ slightly.)
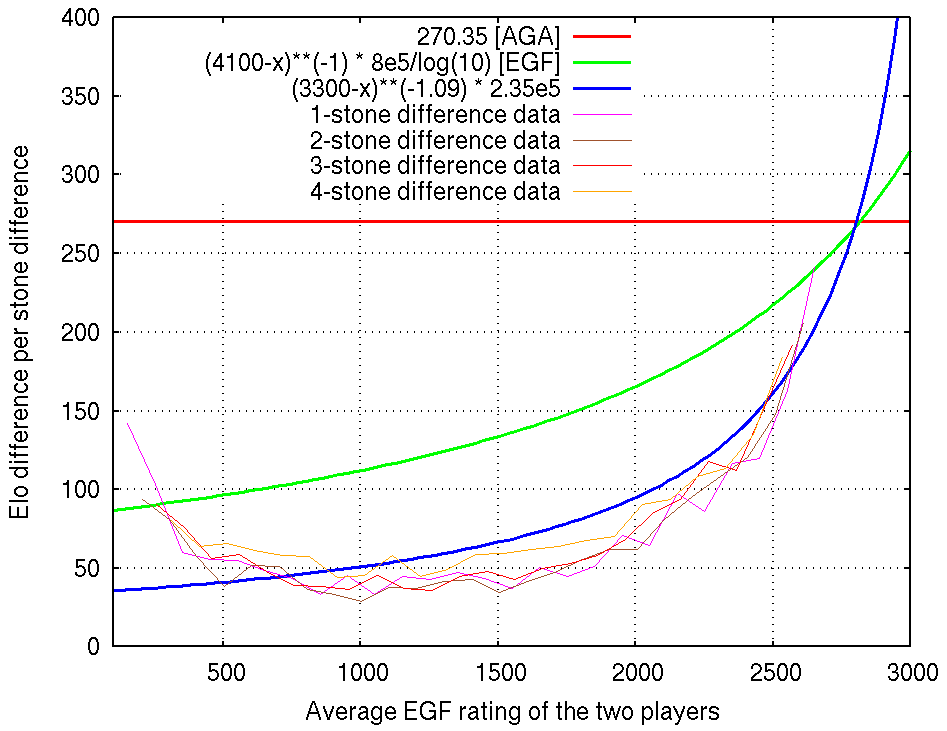
A rating system that reports a dan/kyu rank must internally map a rank difference in stones to a win probability (or equivalently to an Elo difference). Unfortunately, I believe that the mappings used by both the AGA and the EGF are very unrealistic, which is a real shame because other parts of their rating systems are very polished. The worst offender is the AGA which postulates a constant ~270 Elo per stone, which is clearly too much for weak players. The EGF system is better because it attempts to make the value rank-dependent, but the curve used is not ambitious enough and is not a good fit to the EGF's own winning statistics. To fix this, I created the source "Go (pros + EGF + AGA)" which I recommend using for your Go probability needs instead of the individual EGF or AGA sources. In this source I also added ratings for AlphaGo and DeepZenGo based on their recent results, although in the case of AlphaGo we don't really know its true strength.
Below is a graph plotting AGA's constant, EGF's curve, and my proposed homemade curve against actual EGF game statistics from 2006-2015. The actual statistics behave strangely below about 12 kyu, as noted by Geoff Kaniuk when also attempting to fit a model. I think that this is happening because the minimum EGF rank is artificially set to 20 kyu which distorts the winning statistics at the lower end, so we can safely ignore this range. Also the goal shouldn't be to blindly fit the experimental data because in practice we expect some error between a player's rating and their true rank, and we can reason that such noise in the ratings causes the experimental curves to be lower than the curve we would obtain if the players' ratings had time to converge to their true value.
Below I've collected other estimates of the number of Elo points per stone that I could find or derive. I took some of these estimates into account when designing my curve. It's hard to say how reliable each of these is.
| Elo per stone | Source |
|---|---|
| ~50 | Pandanet IGS Ranking System. Points awarded imply values in the range 44-56. |
| 226 for 2d+ 148 for 30k-5k |
KGS Rating Math |
| ~160 according to the figure axis 230 according to the caption |
AlphaGo Nature paper, Figure 4a, citing KGS |
| ~187 for 6-10d KGS 153 for 2-6d KGS |
AlphaGo Nature paper, Extended Data Table 6. From the Elo differences of CrazyStone, Zen and Pachi with 4 handicap stones and komi. Assuming that White is getting the komi, then this is the correct handicap for a 3-stone difference in strength, so the raw Elo differences were divided by 3. |
| 191 | Opening Keynote: "The Story of Alpha Go". "One stone stronger is about 75%". This converts to invEloLogistic(0.75) ≈ 191 (function available on the JavaScript console). |
| 302 for pros | Komi statistics. "a change of 1 point in the value of komi would produce a change of 3.1% in the percentage of games won by black." Assuming that one stone is worth 14 points, then some bold extrapolation gives invEloLogistic(0.5 + 0.031) * 14 ≈ 302 (function available on the JavaScript console). |
| ~infinite for ~13d | Hand of God. "most estimates place God three ranks above top professionals." The EGF scale sets 1p = 7d and 9p = 9.4d, so top pros might be close to 10d. |
Sadly the AlphaGo video claims that some constant value works across all levels. My guess is that the AlphaGo team only deals with professional-level strength, so they never encountered any problem with using a constant. The IGS value may seem out of place, but the median player strength on IGS is about 4 kyu and 50 Elo per stone is a good match for that according to my curve.
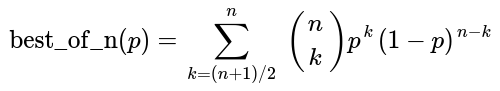
Let's take tennis as our setting. If the probability of winning a set is p, then the probability of winning a best-of-n match can be obtained by summing the tail of a binomial distribution. The result is a function mapping a probability to another probability. We will call this function best_of_n, where n is an odd number.
Remember that the Elo formula (the first graph of the page) converts an Elo difference to a probability. By sandwiching the best_of_n function between the Elo formula and its inverse, we can observe the effect of a best-of-n match in units of Elo.
To explain what this means, suppose we run a rating system "A" based on the results of individual sets, and another rating system "B" based on the results of best-of-n matches. If the Elo difference between two tennis players is elo_diff in rating system A, then we expect their Elo difference to be new_elo_diff in rating system B.
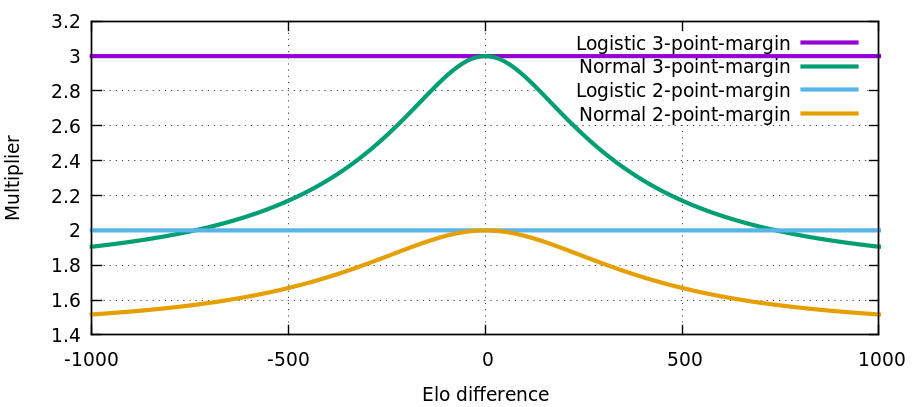
The effect of best-of-n is close to multiplying elo_diff by a constant depending on n, but not quite. Below, we plot the ratio new_elo_diff / elo_diff for two best-of values (3 and 5) and for two Elo formulas (logistic and normal).
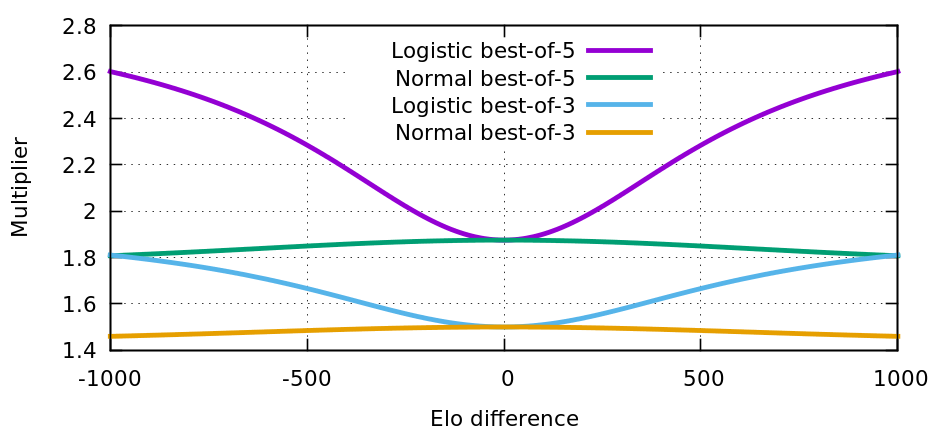
For elo_diff close to zero, the ratio is 3/2 for best-of-3, and 15/8 for best-of-5. These values can be derived by looking at the linear term of the Taylor expansion of the function best_of_n(p) at p=1/2.
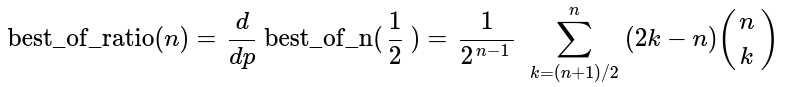
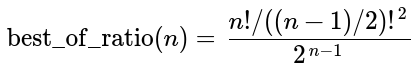
This simplifies to the following expression, where the numerator is the integer A002457((n-1)/2).
It is unfortunate that the effect of best-of-n on Elo is not simply a scaling. When the calculator transforms Elo for tennis, it uses the formula for new_elo_diff given above. This works because only 2 players are involved. If there are 3 players or more with different Elo ratings, then it is impossible to map these Elo ratings to new ratings such that the formula giving new_elo_diff holds for all pairs of players, but a good approximation is to scale Elo by best_of_ratio(n). Another reasonable option is to estimate the average absolute Elo difference between players, to look up the corresponding multiplier in the graph above, and to scale Elo by this multiplier.
In the graph, we note that the curves using the normal distribution are more flat than when using the logistic distribution. This indicates that Elo using the normal distribution is a better model for games which are best-of-n of independent sub-games.
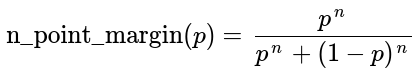
For comparison, another match format is to play games until a player wins by a specified point-margin. This match format has the disadvantage that there is no bound on the number of games that will be played. The probability of winning by an n-point margin is equivalent to the gambler's ruin problem with an unfair coin and is given by the equation below. This match format is a perfect fit for the logistic Elo formula, as shown by the plot below.
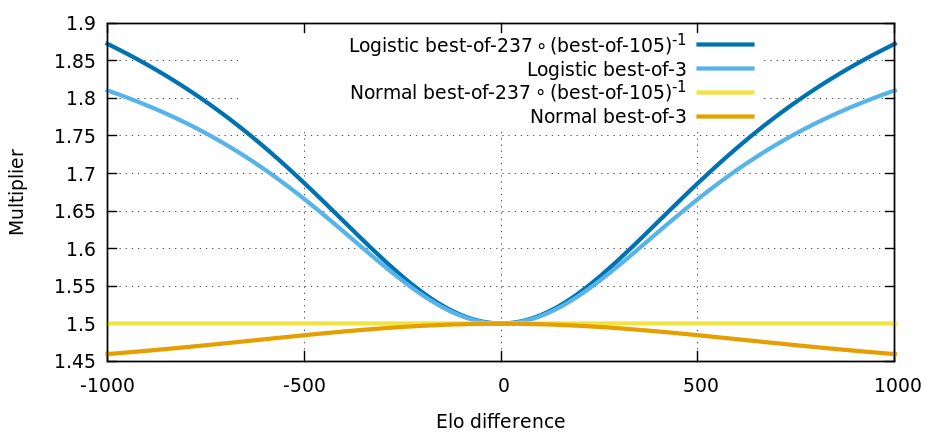
To illustrate what the normal Elo formula is really optimizing for, below is a similar graph for the function best_of_237 ∘ (best_of_105)-1. The strange numbers are simply large numbers such that best_of_ratio(237) / best_of_ratio(105) ≈ 1.500388, which is close to 1.5. In other words, if the game we're playing is already a best-of-105 of something more basic, then instead of doing a best-of-3 of best-of-105, how about changing the game to a best-of-237 of basic elements? This is intuitively a more accurate procedure, so it makes sense that the normal Elo formula is optimized for that. This explains why the normal Elo formula is not a perfect fit for best-of-n when n is small.
Page created: September 29, 2016
Page updated: January 24, 2021 (fixed a broken link, added a new section "Draws in chess")
Page updated: March 28, 2021 (added a new section "Effect of best-of-n on Elo")
Page updated: April 2, 2021 (for Tennis, adjusted calculator to the fact that source ratings are best-of-3, and not a mix)
back to François Labelle's homepage